Example of Operation Count
[1]:
# import openLA as la
import OpenLA as la
[2]:
course_info, event_stream = la.start_analysis(files_dir="dataset_sample", course_id="A")
Before conversion
[3]:
event_stream.df
[3]:
| userid | contentsid | operationname | pageno | marker | memo_length | devicecode | eventtime | |
|---|---|---|---|---|---|---|---|---|
| 0 | A_U1 | C1 | PREV | 10 | NaN | 0 | tablet | 2018-04-09 10:57:15 |
| 1 | A_U1 | C1 | PREV | 9 | NaN | 0 | tablet | 2018-04-09 11:00:59 |
| 2 | A_U1 | C1 | PREV | 8 | NaN | 0 | tablet | 2018-04-09 11:03:31 |
| 3 | A_U1 | C1 | PREV | 30 | NaN | 0 | tablet | 2018-04-10 10:14:12 |
| 4 | A_U1 | C1 | PREV | 29 | NaN | 0 | tablet | 2018-04-10 10:27:24 |
| ... | ... | ... | ... | ... | ... | ... | ... | ... |
| 263279 | A_U99 | C8 | NEXT | 3 | NaN | 0 | pc | 2018-06-05 16:16:18 |
| 263280 | A_U99 | C8 | ADD MARKER | 4 | difficult | 0 | pc | 2018-06-05 16:18:34 |
| 263281 | A_U99 | C8 | NEXT | 4 | NaN | 0 | pc | 2018-06-05 16:19:24 |
| 263282 | A_U99 | C8 | NEXT | 5 | NaN | 0 | pc | 2018-06-05 16:20:45 |
| 263283 | A_U99 | C8 | PREV | 6 | NaN | 0 | pc | 2018-06-05 16:21:03 |
263284 rows × 8 columns
After conversion: the operation count in each contents
[4]:
operation_count = la.convert_into_operation_count(event_stream=event_stream,
                                                  user_id=course_info.user_id()[:2],
                                                  contents_id=course_info.contents_id()[:2],
                                                  operation_name=["OPEN", "CLOSE", "ADD MARKER", "ADD MEMO", "ADD BOOKMARK"],
                                                  separate_marker_type=False)
[5]:
operation_count.df # related to users "A_U1" and "A_U10", and contents "C1" and "C2"
[5]:
| userid | contentsid | OPEN | CLOSE | ADD MARKER | ADD MEMO | ADD BOOKMARK | |
|---|---|---|---|---|---|---|---|
| 0 | A_U1 | C1 | 9 | 8.0 | 2.0 | 0.0 | 3.0 |
| 1 | A_U1 | C2 | 2 | 0.0 | 0.0 | 0.0 | 2.0 |
| 2 | A_U10 | C1 | 2 | 2.0 | 8.0 | 1.0 | 1.0 |
| 3 | A_U10 | C2 | 1 | 1.0 | 0.0 | 0.0 | 0.0 |
Save the data to CSV file
[6]:
operation_count.to_csv(save_file="data.csv")
Aggregate information
[7]:
# Number of users in the data
operation_count.num_users()
[7]:
2
[8]:
# User ids in the data
operation_count.user_id()
[8]:
['A_U1', 'A_U10']
[9]:
# Contents ids in the data
operation_count.contents_id()
[9]:
['C1', 'C2']
[10]:
# Operation names in the data
operation_count.operation_name()
[10]:
['OPEN', 'CLOSE', 'ADD MARKER', 'ADD MEMO', 'ADD BOOKMARK']
[11]:
# Number of selected operation logs
operation_count.operation_count(operation_name="ADD MARKER",
                                user_id="A_U1",
                                contents_id="C1")
[11]:
2.0
[12]:
operation_count.operation_count(operation_name=["ADD MARKER", "ADD BOOKMARK"],
                                user_id="A_U1",
                                contents_id="C1")
[12]:
{'ADD MARKER': 2.0, 'ADD BOOKMARK': 3.0}
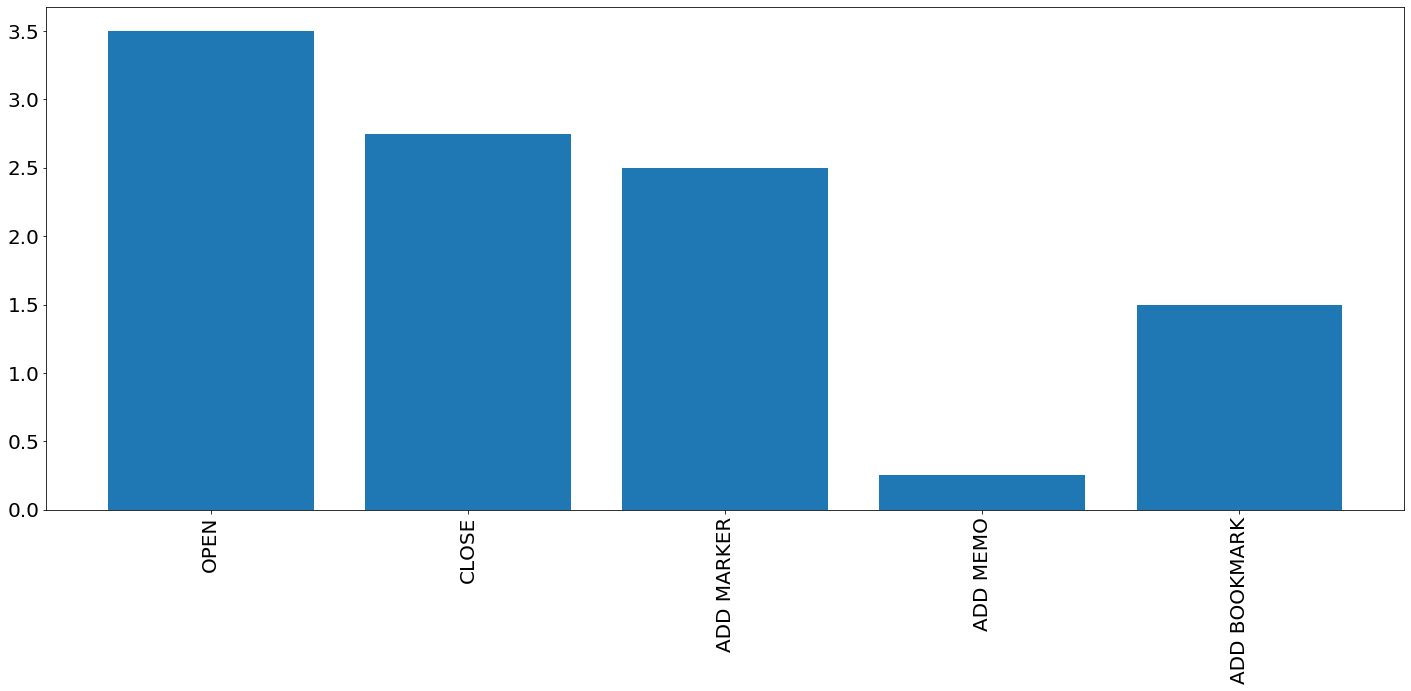
Visualize information
The average operation count of all users in all contents.
[16]:
la.visualize_operation_count_bar(operation_count,
                                 user_id=None,
                                 contents_id=None,
                                 operation_name=None,
                                 calculate_type="average",
                                 xlabel=None,
                                 ylabel=None,
                                 ax=None,
                                 figsize=(20, 10),
                                 fontsize=20,
                                 save_file=None)
[16]:
<matplotlib.axes._subplots.AxesSubplot at 0x168c961b860>