Example of Time-range Aggregation
[1]:
# import openLA as la
import OpenLA as la
[2]:
course_info, event_stream = la.start_analysis(files_dir="dataset_sample", course_id="A")
Before conversion
[3]:
event_stream.df
[3]:
| userid | contentsid | operationname | pageno | marker | memo_length | devicecode | eventtime | |
|---|---|---|---|---|---|---|---|---|
| 0 | A_U1 | C1 | PREV | 10 | NaN | 0 | tablet | 2018-04-09 10:57:15 |
| 1 | A_U1 | C1 | PREV | 9 | NaN | 0 | tablet | 2018-04-09 11:00:59 |
| 2 | A_U1 | C1 | PREV | 8 | NaN | 0 | tablet | 2018-04-09 11:03:31 |
| 3 | A_U1 | C1 | PREV | 30 | NaN | 0 | tablet | 2018-04-10 10:14:12 |
| 4 | A_U1 | C1 | PREV | 29 | NaN | 0 | tablet | 2018-04-10 10:27:24 |
| ... | ... | ... | ... | ... | ... | ... | ... | ... |
| 263279 | A_U99 | C8 | NEXT | 3 | NaN | 0 | pc | 2018-06-05 16:16:18 |
| 263280 | A_U99 | C8 | ADD MARKER | 4 | difficult | 0 | pc | 2018-06-05 16:18:34 |
| 263281 | A_U99 | C8 | NEXT | 4 | NaN | 0 | pc | 2018-06-05 16:19:24 |
| 263282 | A_U99 | C8 | NEXT | 5 | NaN | 0 | pc | 2018-06-05 16:20:45 |
| 263283 | A_U99 | C8 | PREV | 6 | NaN | 0 | pc | 2018-06-05 16:21:03 |
263284 rows × 8 columns
After conversion: Behavior in 1-minute intervals
[4]:
intervals = la.convert_into_time_range(course_info=course_info,
                                       event_stream=event_stream,
                                       interval_seconds=60,
                                       contents_id="C1",
                                       user_id=course_info.user_id()[:5],
                                       lecture_week=2,
                                       start_time='start_of_lecture',
                                       end_time='end_of_lecture',
                                       time_range_basis='minutes',
                                       count_operation=True,
                                       operation_name=["ADD MARKER", "ADD MEMO", "ADD BOOKMARK"])
[5]:
intervals.df
[5]:
| elapsed_minutes | start_of_range | end_of_range | userid | contentsid | pageno | ADD MARKER | ADD MEMO | ADD BOOKMARK | |
|---|---|---|---|---|---|---|---|---|---|
| 0 | 1.0 | 2018-04-17 14:50:00 | 2018-04-17 14:51:00 | A_U1 | C1 | 1 | 0 | 0 | 0 |
| 1 | 2.0 | 2018-04-17 14:51:00 | 2018-04-17 14:52:00 | A_U1 | C1 | 1 | 0 | 0 | 0 |
| 2 | 3.0 | 2018-04-17 14:52:00 | 2018-04-17 14:53:00 | A_U1 | C1 | 3 | 0 | 0 | 0 |
| 3 | 4.0 | 2018-04-17 14:53:00 | 2018-04-17 14:54:00 | A_U1 | C1 | 3 | 0 | 0 | 0 |
| 4 | 5.0 | 2018-04-17 14:54:00 | 2018-04-17 14:55:00 | A_U1 | C1 | 5 | 0 | 0 | 0 |
| ... | ... | ... | ... | ... | ... | ... | ... | ... | ... |
| 445 | 86.0 | 2018-04-17 16:15:00 | 2018-04-17 16:16:00 | A_U102 | C1 | 17 | 0 | 0 | 0 |
| 446 | 87.0 | 2018-04-17 16:16:00 | 2018-04-17 16:17:00 | A_U102 | C1 | 17 | 0 | 0 | 0 |
| 447 | 88.0 | 2018-04-17 16:17:00 | 2018-04-17 16:18:00 | A_U102 | C1 | 17 | 0 | 0 | 0 |
| 448 | 89.0 | 2018-04-17 16:18:00 | 2018-04-17 16:19:00 | A_U102 | C1 | 17 | 0 | 0 | 0 |
| 449 | 90.0 | 2018-04-17 16:19:00 | 2018-04-17 16:20:00 | A_U102 | C1 | 17 | 0 | 0 | 0 |
450 rows × 9 columns
Save the data to CSV file
[6]:
intervals.to_csv(save_file="data.csv")
Aggregate Information
[7]:
# Number of users in the data
intervals.num_users()
[7]:
5
[8]:
# User ids in the data
intervals.user_id()
[8]:
['A_U1', 'A_U10', 'A_U100', 'A_U101', 'A_U102']
[9]:
# Contents ids in the data
intervals.contents_id()
[9]:
['C1']
[10]:
# Operation names in the data
intervals.operation_name()
[10]:
['ADD MARKER', 'ADD MEMO', 'ADD BOOKMARK']
[11]:
# Number of selected operation logs
intervals.operation_count(operation_name="ADD MARKER",
                          user_id="A_U1",
                          contents_id="C1")
[11]:
0
[12]:
intervals.operation_count(operation_name=["ADD MARKER", "ADD BOOKMARK"],
                          user_id="A_U1",
                          contents_id="C1")
[12]:
{'ADD MARKER': 0, 'ADD BOOKMARK': 0}
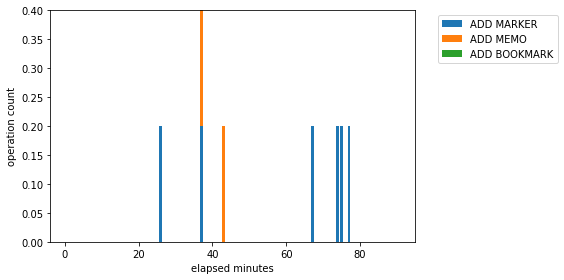
Visualize information
The average operation count of all users in lecture 1
[13]:
la.visualize_operation_in_time_range(intervals,
                                     contents_id="C1",
                                     user_id=None,
                                     operation_name=None,
                                     calculate_type="average",
                                     operation_bar_colors=None,
                                     xlabel=None,
                                     ylabel=None,
                                     ax=None,
                                     figsize=(8, 4),
                                     save_file=None)
[13]:
<matplotlib.axes._subplots.AxesSubplot at 0x2c6b8da1390>
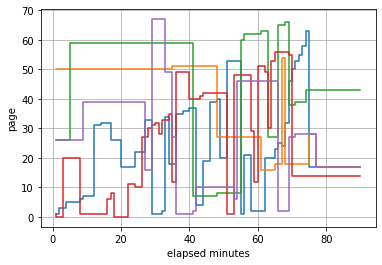
The pages users read in each time in lecture 1
[15]:
la.visualize_pages_in_time_range(intervals,
                                 contents_id=course_info.contents_id()[0],
                                 user_id=None,
                                 xlabel=None,
                                 ylabel=None, ax=None,
                                 figsize=None,
                                 show_legend=False,
                                 save_file=None)
[15]:
<matplotlib.axes._subplots.AxesSubplot at 0x2c6b953a940>
[ ]: