Example of Page-wise Aggregation
[1]:
# import openLA as la
import OpenLA as la
[2]:
course_info, event_stream = la.start_analysis(files_dir="dataset_sample", course_id="A")
Before conversion
[3]:
event_stream.df
[3]:
| userid | contentsid | operationname | pageno | marker | memo_length | devicecode | eventtime | |
|---|---|---|---|---|---|---|---|---|
| 0 | A_U1 | C1 | PREV | 10 | NaN | 0 | tablet | 2018-04-09 10:57:15 |
| 1 | A_U1 | C1 | PREV | 9 | NaN | 0 | tablet | 2018-04-09 11:00:59 |
| 2 | A_U1 | C1 | PREV | 8 | NaN | 0 | tablet | 2018-04-09 11:03:31 |
| 3 | A_U1 | C1 | PREV | 30 | NaN | 0 | tablet | 2018-04-10 10:14:12 |
| 4 | A_U1 | C1 | PREV | 29 | NaN | 0 | tablet | 2018-04-10 10:27:24 |
| ... | ... | ... | ... | ... | ... | ... | ... | ... |
| 263279 | A_U99 | C8 | NEXT | 3 | NaN | 0 | pc | 2018-06-05 16:16:18 |
| 263280 | A_U99 | C8 | ADD MARKER | 4 | difficult | 0 | pc | 2018-06-05 16:18:34 |
| 263281 | A_U99 | C8 | NEXT | 4 | NaN | 0 | pc | 2018-06-05 16:19:24 |
| 263282 | A_U99 | C8 | NEXT | 5 | NaN | 0 | pc | 2018-06-05 16:20:45 |
| 263283 | A_U99 | C8 | PREV | 6 | NaN | 0 | pc | 2018-06-05 16:21:03 |
263284 rows × 8 columns
Behavior in each page (the total staying seconds and operation count in each page)
[4]:
behavior_each_page = la.convert_into_page_wise(event_stream=event_stream,
                                               user_id=course_info.user_id()[:5],
                                               contents_id=None,
                                               invalid_seconds=5,
                                               timeout_seconds=20*60,
                                               count_operation=True,
                                               operation_name=["OPEN", "CLOSE", "ADD MARKER", "ADD MEMO", "ADD BOOKMARK"],
                                               separate_marker_type=False)
[5]:
behavior_each_page.df
[5]:
| userid | contentsid | pageno | num_visits | average_reading_seconds | reading_seconds | OPEN | CLOSE | ADD MARKER | ADD MEMO | ADD BOOKMARK | |
|---|---|---|---|---|---|---|---|---|---|---|---|
| 0 | A_U1 | C1 | 1 | 12 | 148.416667 | 1781 | 8 | 0 | 0 | 0 | 0 |
| 1 | A_U1 | C1 | 2 | 8 | 240.500000 | 1924 | 0 | 1 | 2 | 0 | 0 |
| 2 | A_U1 | C1 | 3 | 5 | 93.400000 | 467 | 0 | 0 | 0 | 0 | 0 |
| 3 | A_U1 | C1 | 4 | 6 | 74.833333 | 449 | 0 | 0 | 0 | 0 | 0 |
| 4 | A_U1 | C1 | 5 | 6 | 87.833333 | 527 | 0 | 0 | 0 | 0 | 0 |
| ... | ... | ... | ... | ... | ... | ... | ... | ... | ... | ... | ... |
| 1734 | A_U102 | C8 | 79 | 6 | 46.166667 | 277 | 0 | 0 | 0 | 0 | 0 |
| 1735 | A_U102 | C8 | 80 | 6 | 44.166667 | 265 | 0 | 0 | 0 | 0 | 0 |
| 1736 | A_U102 | C8 | 81 | 4 | 28.250000 | 113 | 0 | 0 | 0 | 0 | 0 |
| 1737 | A_U102 | C8 | 82 | 6 | 143.500000 | 861 | 0 | 0 | 0 | 0 | 0 |
| 1738 | A_U102 | C8 | 83 | 4 | 100.000000 | 400 | 0 | 0 | 0 | 0 | 0 |
1739 rows × 11 columns
Save the data to CSV file
[6]:
behavior_each_page.to_csv(save_file="data.csv")
Aggregate information
[7]:
# Number of users in the data
behavior_each_page.num_users()
[7]:
5
[8]:
# User ids in the data
behavior_each_page.user_id()
[8]:
['A_U1', 'A_U10', 'A_U100', 'A_U101', 'A_U102']
[9]:
# Contents ids in the data
behavior_each_page.contents_id()
[9]:
['C1', 'C2', 'C3', 'C4', 'C5', 'C7', 'C8', 'C6']
[10]:
# Operation names in the data
behavior_each_page.operation_name()
[10]:
['OPEN', 'CLOSE', 'ADD MARKER', 'ADD MEMO', 'ADD BOOKMARK']
[11]:
# Number of selected operation logs
behavior_each_page.operation_count(operation_name="ADD MARKER",
                                   user_id="A_U1",
                                   contents_id="C1")
[11]:
2
[12]:
behavior_each_page.operation_count(operation_name=["ADD MARKER", "ADD BOOKMARK"],
                                   user_id="A_U1",
                                   contents_id="C1")
[12]:
{'ADD MARKER': 2, 'ADD BOOKMARK': 3}
[13]:
# Number of unique pages in the data
behavior_each_page.num_unique_pages(user_id="A_U1", contents_id="C1")
[13]:
67
[23]:
# Total reading seconds in the data
behavior_each_page.reading_seconds(user_id="A_U1", contents_id="C1")
[23]:
42748
[28]:
# Total reading time in the data (seconds)
behavior_each_page.reading_time(time_unit="seconds", user_id="A_U1", contents_id="C1")
[28]:
42748
[29]:
# Total reading time in the data (minutes)
behavior_each_page.reading_time(time_unit="minutes", user_id="A_U1", contents_id="C1")
[29]:
712.4666666666667
[30]:
# Total reading time in the data (hours)
behavior_each_page.reading_time(time_unit="hours", user_id="A_U1", contents_id="C1")
[30]:
11.874444444444444
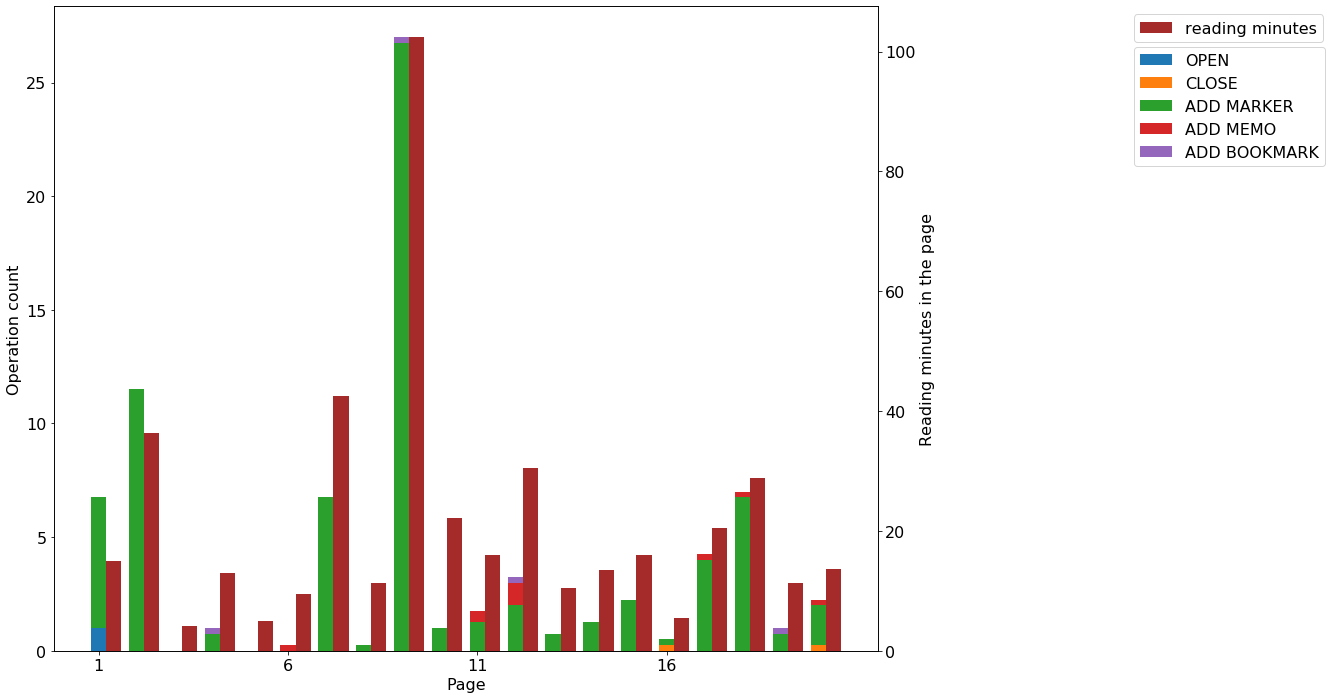
Visualize information
The average operation count of all users in each page.
[26]:
la.visualize_behavior_in_pages(behavior_each_page,
                               user_id=None,
                               contents_id="C6",
                               is_plot_operation=True,
                               is_plot_reading_time=True,
                               operation_name=None,
                               reading_time_basis="minutes",
                               calculate_type="average",
                               operation_bar_colors=None,
                               reading_time_color="brown",
                               figsize=(20, 10),
                               fontsize=18,
                               save_file=None)
[26]:
(<matplotlib.axes._subplots.AxesSubplot at 0x2b9fa73e7b8>,
 <matplotlib.axes._subplots.AxesSubplot at 0x2b9fa934c88>)